
Mathematical Visualization Infographic Prompt
A prompt template for generating academic and visually appealing mathematical visualization infographics that explain complex concepts through hand-drawn style diagrams.
좋아요
859
조회수
9.7만
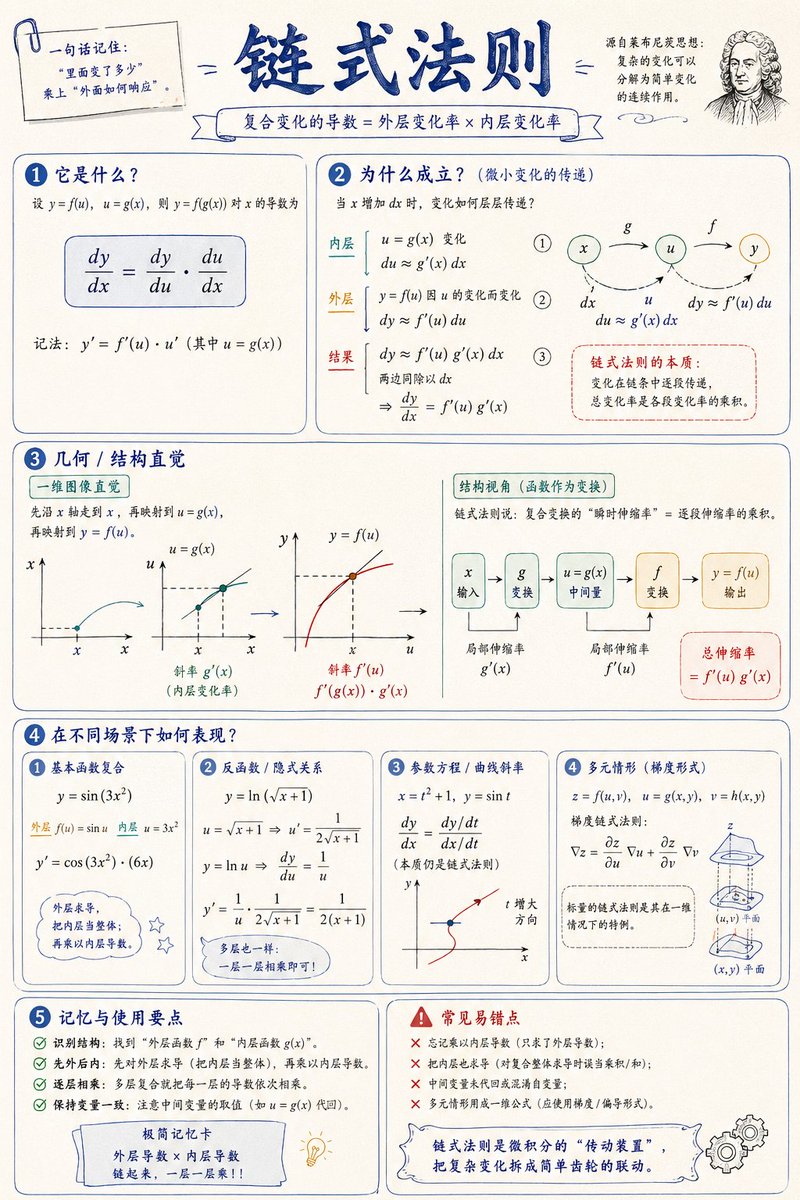
A prompt template for generating academic and visually appealing mathematical visualization infographics that explain complex concepts through hand-drawn style diagrams.
Please create a mathematical visualization infographic about "{argument name="topic" default="mathematical concepts/knowledge points"}" to help readers intuitively understand: what it is, why it holds true, the geometric/structural intuition, and how it behaves in different scenarios. The image should look like a high-quality math lecture handout + hand-drawn educational poster—elegant, clear, and informative without being cluttered. Visual style: {argument name="layout" default="vertical or horizontal"}, clean light-colored paper background, dark blue headings, black/dark gray body lines, accented with a few elegant blue, turquoise, gold, and red colors. Use rounded-corner cards, thin borders, numbered labels, hand-drawn arrows, partial magnification boxes, and summary columns. The overall design should be aesthetic, balanced, and academic, allowing one to immediately grasp the "structure" and "reasoning" behind the concept.
이건 Orelon 라이브러리의 무료 AI 프롬프트예요. 여기에는 자유롭게 복사하고 응용할 수 있는 이미지 프롬프트가 수천 개 더 있어요.
이미지 프롬프트 더 둘러보기




만들 준비됐나요
Orelon에서 이 큐레이션된 방향으로 시작한 다음, 다음 비주얼로 다듬어 가세요.