
Mathematical Visualization Infographic Prompt
A prompt template for generating academic and visually appealing mathematical visualization infographics that explain complex concepts through hand-drawn style diagrams.
点赞
859
浏览
9.7万
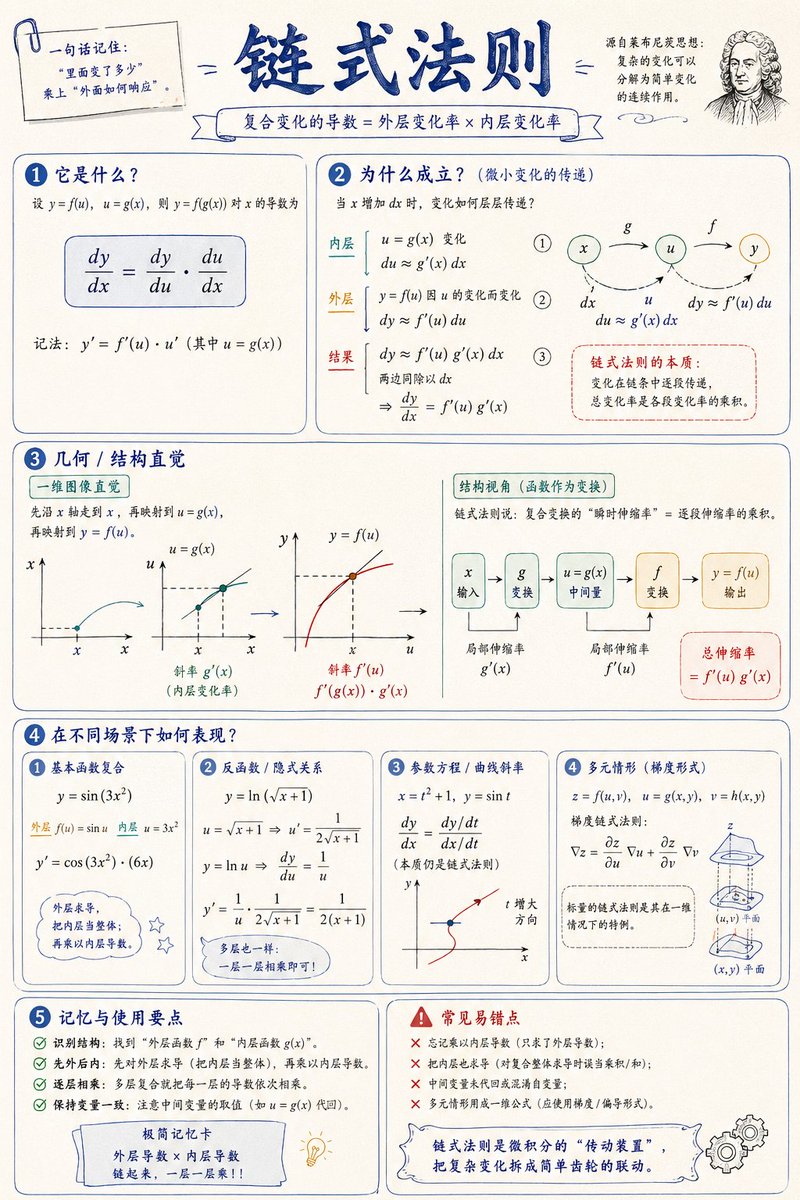
A prompt template for generating academic and visually appealing mathematical visualization infographics that explain complex concepts through hand-drawn style diagrams.
Please create a mathematical visualization infographic about "{argument name="topic" default="mathematical concepts/knowledge points"}" to help readers intuitively understand: what it is, why it holds true, the geometric/structural intuition, and how it behaves in different scenarios. The image should look like a high-quality math lecture handout + hand-drawn educational poster—elegant, clear, and informative without being cluttered. Visual style: {argument name="layout" default="vertical or horizontal"}, clean light-colored paper background, dark blue headings, black/dark gray body lines, accented with a few elegant blue, turquoise, gold, and red colors. Use rounded-corner cards, thin borders, numbered labels, hand-drawn arrows, partial magnification boxes, and summary columns. The overall design should be aesthetic, balanced, and academic, allowing one to immediately grasp the "structure" and "reasoning" behind the concept.
这是 Orelon 提示词库里的一条免费 AI 提示词。这里还有成千上万条图像提示词,都能免费复制和改用。
探索更多图像提示词




准备好就开始
从这条精选创作方向开始,在 Orelon 中塑造你的下一张视觉作品。