

Enable TikTok analytics, read the metrics that actually matter, and turn retention data into better AI video prompts with a repeatable creative workflow.
Analytics on TikTok is one toggle away. The toggle is the easy part. The part that separates growing accounts from stalled ones is what happens after you look at the numbers — whether they change the hook you write, the pacing you cut to, or the visual style you ask a generator to render.
Most creators switch analytics on, glance at views, and go back to guessing. This guide fixes that. First you will get measurement actually running in the app and on the web. Then you will spend most of your time on the harder skill: turning a retention curve into a prompt you can hand to an AI video tool and get a measurably better clip back.
Why your analytics should shape your next prompt
A prompt is a hypothesis. When you write "slow dolly in on a rain-soaked street at dusk, neon reflections, shallow depth of field," you are betting that this look will hold attention. Analytics is how you find out whether the bet paid off — and for how long.
Without that feedback loop, AI video generation becomes a slot machine. You generate ten clips, one performs, and you have no idea which variable mattered. Was it the subject? The opening frame? The camera move? The colour grade? With analytics attached, you can trace a drop-off at second three back to the exact opening image that failed, then regenerate only that piece.
The loop looks like this: publish → measure → diagnose one variable → rewrite one part of the prompt → regenerate → publish. One variable at a time. Creators who run this loop for a month usually learn more than creators who read a year of general advice.
Turning analytics on in TikTok, step by step
Switch to a business or creator account
Personal accounts have limited data. Analytics unlocks properly when your account is set to a business or creator profile. In the app, go to your profile, open the menu, then Settings and privacy → Account → Switch to Business Account. Pick the category that best matches your content. You can switch back later, but the deeper data is worth keeping.
Enable the analytics view
On a business account, open your profile and look for the analytics entry in the menu (sometimes shown as Business suite or Creator tools). If you do not see it, update the app first — the menu moved several times across versions. On the web, sign in at tiktok.com and open the Business Suite or Analytics section in the left sidebar, which gives you wider tables and longer date ranges than the phone.
Confirm data is actually flowing
New accounts and newly switched accounts often show empty charts for the first day or two. Publish one video, wait a few hours, then refresh. If the overview loads but individual videos show no detail, that is usually a delay rather than a permission problem.
If analytics still will not appear
Check three things in order: the account type (personal accounts hide most of it), the app version, and the region. Some features roll out unevenly. If the in-app view is missing entirely, the web dashboard is the reliable fallback, and it is the better place to work anyway because you can compare videos side by side.
TikTok's own help centre documents the account-type requirement in more detail if you get stuck at the permission step.
The metrics that should change your next video
Views are a vanity number. These are the ones that actually feed back into creative decisions.
Average watch time
The single most useful figure in the dashboard. If a fifteen-second video holds an average of six seconds, you have a structural problem, not a taste problem. Note this number before you change anything so you can tell whether the change worked.
Full-watch and rewatch behaviour
A video that people loop is worth more than a video that people finish once. Rewatches suggest the visual payoff landed. If rewatches are high but follows are low, the content is satisfying but not identity-forming — that is a series problem, not a clip problem.
Traffic source
For You, profile, search, and sound pages behave like different audiences. Search traffic on TikTok is rising fast, which means your opening line now doubles as a search query. If 30% of your views arrive from search, put the topic word in the first two seconds of speech and on-screen text.
Follower versus non-follower split
A healthy account shows most views coming from non-followers on new posts. If nearly everything comes from followers, the algorithm is not finding new people — usually a sign that the first frame looks like your other first frames.
The shape of the retention curve
Two shapes matter. A cliff in the first two seconds means the opening frame or first spoken word failed. A slow bleed after the midpoint means the middle lost tension. These are different problems with different fixes, and the curve tells you which one you have.
Saves, shares, and comments
Saves indicate practical value. Shares indicate identity value — people send clips that say something about them. Comments are noisy but a comment asking "how did you make this" is the strongest possible signal that your visual style is doing work.
Reading the data honestly
Small samples lie. A video with 400 views does not have a reliable retention percentage; one person leaving early swings the number by whole points. Only compare videos once each has a few thousand views, and compare within the same format rather than across formats.
Also separate distribution from quality. A clip can have excellent retention and tiny reach if it was published at a bad time or with weak on-screen text for the search layer. Look at retention and reach as two separate scores before you rewrite anything.
Finally, resist the urge to attribute everything to the algorithm. If three consecutive videos drop at second four, the common variable is you.
From numbers to prompts: a repeatable AI video workflow
This is where the analytics start paying for themselves. The workflow below fits any generator, including Orelon's AI video generator, and it works for talking-head content, product clips, and pure visuals.
Step 1 — Pick exactly one metric to move
Write it down. "Raise average watch time on fifteen-second clips from six to nine seconds." One metric, one format, one month. Multi-metric goals produce unfalsifiable results.
Step 2 — Find where attention breaks
Open the retention curve and note the timestamp of the steepest drop. Convert it to a fraction of the clip. A drop at second two in a fifteen-second video means the failure is in the first 13% of the runtime.
Step 3 — Rewrite the hook as a visual instruction, not an idea
"Make it more engaging" is not a prompt. "Extreme close-up of a hand snapping a film slate, dust visible in a hard key light, camera pushes in 10% over one second" is a prompt. The difference between a failing hook and a working one is usually specificity of the first frame.
Step 4 — Generate variants, not one hero clip
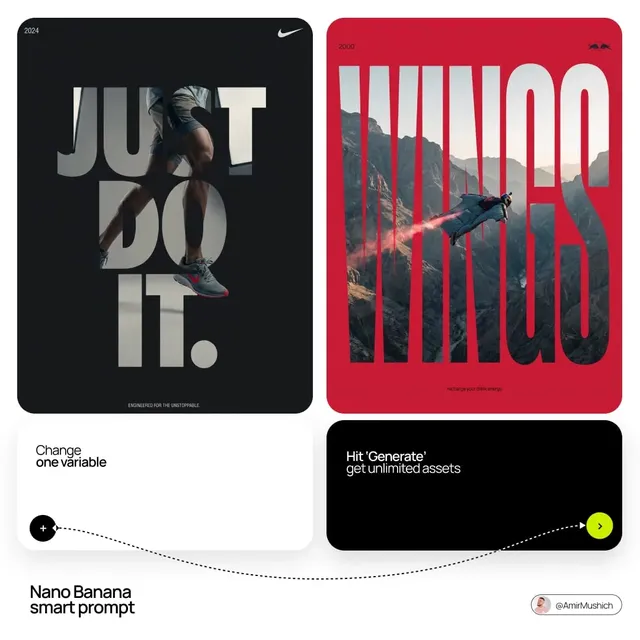
Produce four to six variations that differ in exactly one dimension: camera distance, lighting direction, subject motion, or opening colour. Keep everything else identical. If you change four things at once, you learn nothing.
Step 5 — Log the result in a prompt library
Keep a running document: prompt text, seed or settings, retention result, and one sentence of interpretation. After twenty entries you will have a private playbook that no general tutorial can give you. A prompt library is the cheapest creative asset you will ever build.
Step 6 — Reuse the winning structure, not the winning clip
When a variant wins, extract the structure — close-up opener, single light source, slow push in — and apply it to a different subject. That is how a style develops instead of a lucky post.
A worked example: the eight-second cliff
Suppose a twenty-second product clip averages eleven seconds watched, with a hard drop at second eight. The first eight seconds are fine. Something at second eight kills the video.
Watch your own clip at second eight. Common culprits: a hard cut to a wide shot that removes the subject, a music drop that resets attention, a caption that resolves the question too early, or a colour shift that reads as a scene change.
The fix is a single generated bridge. Instead of cutting wide, generate a slow parallax move on the same subject with a light change instead of a location change. Same subject, new energy. Publish the original and the bridged version within the same week, keep the hook identical, and compare average watch time.
If the bridge lifts average watch time from eleven to fourteen seconds, you have learned something durable: your audience tolerates continuous motion but resists location cuts. That rule now applies to every clip you make, and it cost you one generation round instead of a month of guessing.
Prompt patterns that translate metrics into footage
A few patterns that map directly onto analytics problems:
- Two-second cliff. Add a physical action in the first frame — a hand entering, a lid opening, fabric moving. Static frames lose people; motion buys the next second.
- Mid-video bleed. Insert a visual escalation every five to six seconds: tighter framing, warmer grade, faster move. Mark the beats before you generate.
- High views, low follows. Your clips look interchangeable. Give the series a consistent but distinctive opening device — a fixed lens, a recurring prop, a signature colour — so viewers recognise you in the feed.
- High saves, low shares. Your content is useful but not expressive. Add a line that states a point of view people can send to someone.
- Search-driven traffic. Put the topic phrase into the opening shot as on-screen text, then generate a frame that visually explains it. Text plus image together is what makes a search result clickable.
When you need a starting structure rather than a blank page, video templates are useful scaffolding — but treat them as a skeleton and change at least one visual variable so the result does not look stock.
Common mistakes that waste the data
Changing five things after one bad post. You will never know what worked. Change one variable per round.
Judging by likes. Likes correlate with reach, not with retention. Watch time is the number that predicts future reach.
Generating the whole video before checking the hook. Generate the first three seconds first, review it at full size on a phone screen, then commit to the rest. Most failures are decided in the first frame.
Ignoring the audio-visual handshake. If the first spoken word lands half a second after the visual cut, retention drops and no prompt tweak fixes it. Sync matters as much as style.
Never re-testing a losing idea. A hook can fail for reasons unrelated to the idea — bad timing, weak text, a confusing frame. Retest promising concepts once before discarding them.
Where AI helps and where you still decide
AI video generation is excellent at producing variants at volume, holding a visual style consistent across clips, and generating the odd shot you could not film. It is not good at knowing what your audience cares about. That comes from the analytics panel and from reading your own comments.
The division of labour that works: you decide the claim, the pacing target, and the success metric; the generator handles execution and variation. If you are comparing tools, it helps to know how they differ on shot length, motion control, and consistency — our alternatives overview covers the trade-offs without turning into a spec sheet.
FAQ
Why can't I see analytics on TikTok?
Most often the account is still a personal profile. Switching to a business or creator account unlocks the dashboard. After that, check for an app update and give new posts a few hours before data appears.
Does switching to a business account reduce reach?
There is a persistent myth about this. Business accounts give up access to some commercial sounds, which can affect certain formats, but measurement is worth more than a sound library for most creators. If you rely heavily on trending audio, use a creator account instead.
What is a good average watch time?
Compare against your own baseline, not a benchmark. A useful target is holding more than half the runtime on clips under twenty seconds. If you are below that, fix the first two seconds before touching anything else.
How many videos do I need before the data means anything?
At least five to eight in the same format, each with a few thousand views. Below that, you are reading noise.
Can AI tools read my TikTok analytics directly?
Some platforms offer connectors, but you rarely need one. Manual review takes ten minutes a week and forces you to articulate the problem, which is the part that actually improves your prompts.
How often should I change my visual style?
Change when the data tells you to, not on a schedule. A consistent look builds recognition; a consistent look that never evolves builds fatigue. Re-test the opening frame every few weeks and keep the rest stable.
Start the loop with your next clip
You now have the whole cycle: switch analytics on, read the curve, isolate one variable, and regenerate only the part that failed. It is a small amount of work repeated consistently, and it compounds faster than any single viral attempt.
When you are ready to test your first hypothesis, generate a short clip with Orelon, run four variants that differ in one dimension, and publish them within the same week. Then open the retention curve and let the numbers pick the winner. That is the entire method — the rest is repetition.